Ice melting in a H2O-NaCl inclusion
Introduction
More generally speaking natural fluids contain a significant quantity of dissolved salt. Chlorides and particularly sodium chloride (NaCl) are the most common salts in nature.
Ice melting in salt-bearing solutions is an indicator of the total salinity. Ice in pure water melts at 0.0°C, ice melting temperature can be depressed down to -21.2°C as a function of salinity.
Two phase transitions can theoretically be measured, the eutectic temperature (also called “first ice melting”) and the melting of the last ice crystal.
Video
The video presents the ice melting phenomenon in a fluid inclusion of the Zimapán lead-zinc deposit (México). The studied sample (fluorite) contains two-phase fluid inclusions (liquid+vapour) that have trapped a low salinity fluid. Whereas this inclusion could be used to observe both eutectic melting and melting of the last ice crystal, it only presents the final ice melting.
Video description
The experiment starts at room temperature . The two-phase (liquid+vapour) inclusion is cooled. No change occurs down to -47.8°C.
At this temperature the liquid suddenly crystallizes. This change is marked by a visible contraction of the vapour bubble and an intense browning.
At this temperature the phase present in this inclusions are composed of a mixture of ice and hydrohalite (hydratez NaCl.2H2O) and ice, in addition to vapour.
During heating no change occurs up to -21.2°C corresponding to the eutectic temperature of the H2O-NaCl system.
At this temperature of the liquid phase the solidified liquid starts to melt (phase transition not shown in the video). The whole hydrohalite and a large quantity of ice melt, producing the first liquid droplets.
Going on heating the inclusion one can observe the melting of rounded ice crystals. The number of ice crystals decreases as well as the size of the crystals decreases.
At a temperature of -3.4°C the last ice crystal melts. This is the final ice melting temperature.
Interpretation
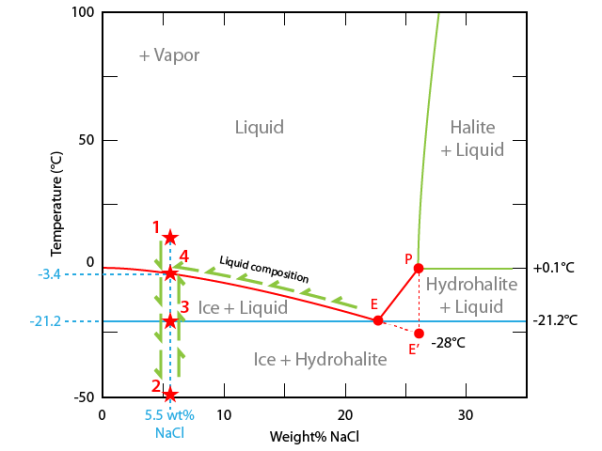
To interpret the microthermometric sequence we will use a composition-temperature diagram for the system H2O-NaCl. Composition (salinity) is expressed as wt% NaCl.
Salinity is calculated as wt% eq. NaCl by reporting the ice melting temperature using the H2O-NaCl phase diagram of the empirical expression given by Bodnar (1993[1])
salinity (wt% NaCl) = 1.78 x θ - 0.0442 x θ2 + 0.0005572 x θ3
where θ is the depression of the freezing point in °C (or absolute value of the final ice melting temperature). In the case of our video (ice melting at -3.4°C) the calculated salinity is 5.6 wt% NaCl.
As composition is considered as constant in a fluid inclusion, the path followed by the inclusion is a vertical line in the composition-temperature diagram.
At room temperature the inclusion lies in the liquid phase (point #1). Vapour is always present during the experiment.
During cooling the inclusion moves downward to about -48°C where this liquid solidifies into a mixture of hydrohalite and ice (point #2).
During heating the fluid inclusion path reaches the eutectic temperature (-21.2°C). At this temperature (point #3). the solidified liquid begins to melt. All hydrohalite goes into solution whereas ice begins to melt. The liquid composition lies at point E. Between eutectic temperature and the final ice melting temperature the inclusion consists of an equilibrium between ice and liquid (NaCl enriched aqueous solution whose composition changes from point E to point#4).
Quantity of ice decreases with temperature.
The final ice melting temperature -3.4°C corresponds to the disappearance of the last ice crystals. The inclusion is located on the solidus curve of the system (point #4).
Going on heating the inclusion will not induce any other change up to room temperature.
More
Without any information on the nature of the dissolved salt, salinity is calculated as wt% eq. NaCl by reporting the ice melting temperature using the H2O-NaCl phase diagram or using the empirical expression given by Bodnar (1993)[1].
Phase diagrams for other H2O-alkali chloride (KCl, RbCl, CsCl, MgCl2, CaCl2, LiCl, ...) systems can be found in the literature (see Dubois et al., 1993[2]; Monnin and Dubois, 1999[3]; Monnin et al., 2002[4]).